© 2025 American Dental Association l 53
Fluoridation Facts
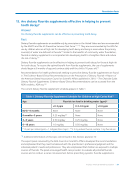
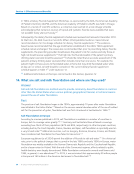
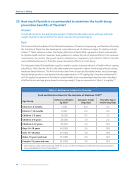
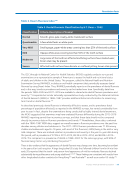
Table 3. Dean’s Fluorosis Index245
Table 3. Dental Fluorosis Classification by H.T. Dean – 1942
Classification Criteria-Description of Enamel
Normal Smooth, gloss, pale creamy-white translucent surface
Questionable A few white flecks or white spots
Very Mild Small opaque, paper-white areas covering less than 25% of the tooth surface
Mild Opaque white areas covering less than 50% of the tooth surface
Moderate Large areas of the tooth are affected and biting surfaces have marked wear
brown stain may be present
Severe Affected tooth surfaces have discrete or confluent pitting brown stain present
The CDC through its National Center for Health Statistics (NCHS) regularly conducts surveys and
examinations on a representative sample of Americans to assess the health and nutritional status
of adults and children in the United States. This program, called the National Health and Nutrition
Examination Survey (NHANES), includes an oral health component that periodically assesses dental
fluorosis by using Dean’s Index. Thus, NHANES periodically reports on the prevalence of dental fluorosis
and, in this way, trends in prevalence and severity can be tracked over time. Specifically, data from
the periods 1999–2004 and 2011–2016 are available to characterize dental fluorosis prevalence and
severity.246 A separate but similar nationally representative study conducted by the National Institute
of Dental Research (NIDR) in 1986–1987 provides additional historical information to assess long-
term trends in dental fluorosis.247
As described previously, dental fluorosis is inherently difficult to assess, and its prevalence (total
percentage of population affected), as reported in the NHANES surveys, has varied considerably from
year to year. In fact, despite the examinations being conducted by highly trained dental examiners,
the NCHS suggested that examiners may have evaluated fluorosis differently during the 2012–2016
NHANES reporting period than in previous surveys, and that these data should not be compared
directly to previous data on fluorosis prevalence and trends.246 Nonetheless, these data, combined
with the 1986–1987 NIDR data, suggest an overall increase in fluorosis prevalence over the past four
decades among children and adolescents. The 2011–2016 fluorosis prevalence was 71.5% among
children and adolescents aged 6–19 years, with most of this fluorosis (~80%) being in the mild or very
mild categories. There was marked variation in prevalence and severity in the year-to-year data during
this period, with a prevalence of 57.0% in 2011–2012, 88.3% in 2013–2014, and 68.9% in 2015–
2016. This compares to a prevalence of 36.6% in 1999–2004 for the same age group, with 90% of
fluorosis being mild or very mild during this period.246
There is also evidence that the appearance of dental fluorosis may change over time, becoming less evident
in the years after tooth eruption. A large longitudinal US study that followed children from birth into their
early 20s reported that the tooth- and person-level appearance of mild to moderate fluorosis declined
substantially during adolescence and young adulthood.248,249 These findings are consistent with results from
other longitudinal studies conducted in Hong Kong250 and Australia251 as well as an earlier US study.252
Fluoridation Facts
Table 3. Dean’s Fluorosis Index245
Table 3. Dental Fluorosis Classification by H.T. Dean – 1942
Classification Criteria-Description of Enamel
Normal Smooth, gloss, pale creamy-white translucent surface
Questionable A few white flecks or white spots
Very Mild Small opaque, paper-white areas covering less than 25% of the tooth surface
Mild Opaque white areas covering less than 50% of the tooth surface
Moderate Large areas of the tooth are affected and biting surfaces have marked wear
brown stain may be present
Severe Affected tooth surfaces have discrete or confluent pitting brown stain present
The CDC through its National Center for Health Statistics (NCHS) regularly conducts surveys and
examinations on a representative sample of Americans to assess the health and nutritional status
of adults and children in the United States. This program, called the National Health and Nutrition
Examination Survey (NHANES), includes an oral health component that periodically assesses dental
fluorosis by using Dean’s Index. Thus, NHANES periodically reports on the prevalence of dental fluorosis
and, in this way, trends in prevalence and severity can be tracked over time. Specifically, data from
the periods 1999–2004 and 2011–2016 are available to characterize dental fluorosis prevalence and
severity.246 A separate but similar nationally representative study conducted by the National Institute
of Dental Research (NIDR) in 1986–1987 provides additional historical information to assess long-
term trends in dental fluorosis.247
As described previously, dental fluorosis is inherently difficult to assess, and its prevalence (total
percentage of population affected), as reported in the NHANES surveys, has varied considerably from
year to year. In fact, despite the examinations being conducted by highly trained dental examiners,
the NCHS suggested that examiners may have evaluated fluorosis differently during the 2012–2016
NHANES reporting period than in previous surveys, and that these data should not be compared
directly to previous data on fluorosis prevalence and trends.246 Nonetheless, these data, combined
with the 1986–1987 NIDR data, suggest an overall increase in fluorosis prevalence over the past four
decades among children and adolescents. The 2011–2016 fluorosis prevalence was 71.5% among
children and adolescents aged 6–19 years, with most of this fluorosis (~80%) being in the mild or very
mild categories. There was marked variation in prevalence and severity in the year-to-year data during
this period, with a prevalence of 57.0% in 2011–2012, 88.3% in 2013–2014, and 68.9% in 2015–
2016. This compares to a prevalence of 36.6% in 1999–2004 for the same age group, with 90% of
fluorosis being mild or very mild during this period.246
There is also evidence that the appearance of dental fluorosis may change over time, becoming less evident
in the years after tooth eruption. A large longitudinal US study that followed children from birth into their
early 20s reported that the tooth- and person-level appearance of mild to moderate fluorosis declined
substantially during adolescence and young adulthood.248,249 These findings are consistent with results from
other longitudinal studies conducted in Hong Kong250 and Australia251 as well as an earlier US study.252