90 l © 2025 American Dental Association
Section 4: Public Policy
© 2025 American Dental Association l 90
57. What is public health?
Answer
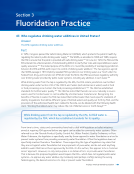
Public health is the science of promoting and protecting the health of people and the communities
where they live, learn, work, and play. Public health measures improve the health and quality of
life for members of the community.
Fact
Public health has numerous definitions and dimensions. It can encompass research, education,
regulation, policy, and more. It focuses on the health of entire populations that can vary in size from
as small as a local neighborhood to a small community and a large city. It also can focus on populations
with a state, national, or even global perspective. But how does public health affect our everyday
lives? Individuals are touched by public health measures every day without giving them a second
thought. For example, garbage pickup and disposal prevent the spread of disease. The stoplight at a
busy intersection protects motorists and pedestrians from injury. Building sidewalks in communities
promotes walking and outdoor physical activity to reduce dependence on motor vehicles and help
prevent chronic disease. Smoke-free laws help prevent lung cancer and other smoking-related
diseases. All of these are public health in action.
During the 20th century, the health and life expectancy of US residents improved dramatically.
Since 1900, the average lifespan of persons in the United States increased by more than 30 years.
Twenty-five years of that gain are attributable to advances in public health. Many notable public health
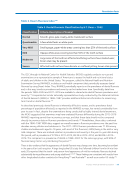
achievements occurred during the 1900s. In a series of reports during 1999, the CDC’s Morbidity and
Mortality Weekly Report (MMWR) profiled 10 public health achievements chosen to highlight the
contributions of public health and to describe the impact of these contributions on the health and
well-being of persons in the United States.1
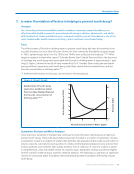
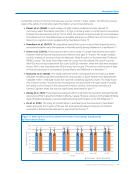
In discussing the contribution of fluoridation, the October 22, 1999, MMWR2 noted that the fluoridation
of community drinking water was a major factor responsible for the decline in tooth decay during the
second half of the 20th century.
In discussing the contribution of fluoridation, the October 22, 1999, MMWR2
noted that the fluoridation of community drinking water was a major factor
responsible for the decline in tooth decay during the second half of the 20th
century.
Public Policy
Section 4
Section 4: Public Policy
© 2025 American Dental Association l 90
57. What is public health?
Answer
Public health is the science of promoting and protecting the health of people and the communities
where they live, learn, work, and play. Public health measures improve the health and quality of
life for members of the community.
Fact
Public health has numerous definitions and dimensions. It can encompass research, education,
regulation, policy, and more. It focuses on the health of entire populations that can vary in size from
as small as a local neighborhood to a small community and a large city. It also can focus on populations
with a state, national, or even global perspective. But how does public health affect our everyday
lives? Individuals are touched by public health measures every day without giving them a second
thought. For example, garbage pickup and disposal prevent the spread of disease. The stoplight at a
busy intersection protects motorists and pedestrians from injury. Building sidewalks in communities
promotes walking and outdoor physical activity to reduce dependence on motor vehicles and help
prevent chronic disease. Smoke-free laws help prevent lung cancer and other smoking-related
diseases. All of these are public health in action.
During the 20th century, the health and life expectancy of US residents improved dramatically.
Since 1900, the average lifespan of persons in the United States increased by more than 30 years.
Twenty-five years of that gain are attributable to advances in public health. Many notable public health
achievements occurred during the 1900s. In a series of reports during 1999, the CDC’s Morbidity and
Mortality Weekly Report (MMWR) profiled 10 public health achievements chosen to highlight the
contributions of public health and to describe the impact of these contributions on the health and
well-being of persons in the United States.1
In discussing the contribution of fluoridation, the October 22, 1999, MMWR2 noted that the fluoridation
of community drinking water was a major factor responsible for the decline in tooth decay during the
second half of the 20th century.
In discussing the contribution of fluoridation, the October 22, 1999, MMWR2
noted that the fluoridation of community drinking water was a major factor
responsible for the decline in tooth decay during the second half of the 20th
century.
Public Policy
Section 4