© 2025 American Dental Association l 91
Fluoridation Facts
58. Is water fluoridation a valuable public health measure?
Answer
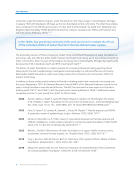
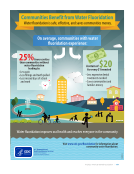
Yes. Community water fluoridation is a public health measure that benefits people of all ages and
saves money for families and the health care system. Because fluoridation reaches large numbers
of people where they live, learn, work, and play, it is more efficient than other forms of fluoride
delivery. Water fluoridation reaches everyone in the community regardless of age, race, education,
income level, or access to routine dental care. Because of the important role community water
fluoridation has played in the reduction of tooth decay, the CDC has proclaimed it one of 10 great
public health achievements of the 20th century.1,2
Fact
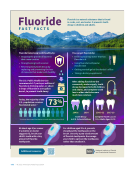
Throughout decades of research and more than 80 years of practical experience, the fluoridation of
public water supplies has been responsible for dramatically improving the public’s oral health.
Oral Health in the 1930s and 1940s
It has been said that those who cannot remember the past are condemned to repeat it. As generations
pass, details from life in the 1930s and 1940s fade. The oral health of Americans suffered greatly during
the Great Depression and into World War II. There were no public health programs in place that addressed
tooth decay, and the loss of teeth was viewed as an eventuality. In fact, as World War II approached,
those joining the US Army were required to have six back teeth (three on the top and three on the
bottom) that opposed each other to serve the function of chewing food as well as six front teeth (three
on the top and three on the bottom) that opposed each other for the purpose of biting into food. The
number of men disqualified for dental reasons far exceeded all expectations, as “dental disease” became
the most common reason for military deferment. One out of 11 registrants examined was disqualified for
military service due to dental issues.391 After Pearl Harbor, it was apparent that the manpower needed
to fight a global war could be obtained only if dental standards for induction were drastically relaxed.
By March 1942, the standards had been revised so that a man who was “well nourished, of good
musculature, and free from gross dental infections” but who was completely edentulous (without any
teeth) could be inducted if his condition was corrected or could be corrected with dentures.391
Because fluoridation reaches large numbers of people where they live, learn, work,
and play, it is more efficient than other forms of fluoride delivery.
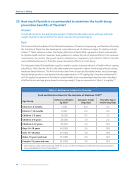
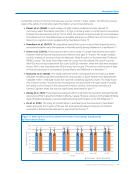
In January 1945, the first US city to include community water fluoridation was Grand Rapids,
Michigan, followed within months by Newburgh, New York (May 1945), Brantford, Ontario (June
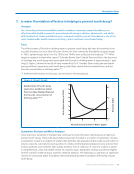
1945), and Evanston, Illinois (February 1947). The comparison of decay rates in the fluoridated cities
versus cities without community water fluoridation showed dramatically lower rates of tooth decay
in fluoridated cities.16 A classic study, the Newburgh-Kingston study of two cities in New York, one
fluoridated (Newburgh) and one non-fluoridated (Kingston), also showed substantially lower decay
rates in Newburgh.21 The optimal level for caries reduction without risk of fluorosis was found to be
1.0 ppm,17 leading to the rapid adoption of fluoridation in cities across the United States. As a result,
tooth decay declined sharply during the second half of the 20th century.18,392 Tooth loss was no
longer considered inevitable.18,392
Fluoridation Facts
58. Is water fluoridation a valuable public health measure?
Answer
Yes. Community water fluoridation is a public health measure that benefits people of all ages and
saves money for families and the health care system. Because fluoridation reaches large numbers
of people where they live, learn, work, and play, it is more efficient than other forms of fluoride
delivery. Water fluoridation reaches everyone in the community regardless of age, race, education,
income level, or access to routine dental care. Because of the important role community water
fluoridation has played in the reduction of tooth decay, the CDC has proclaimed it one of 10 great
public health achievements of the 20th century.1,2
Fact
Throughout decades of research and more than 80 years of practical experience, the fluoridation of
public water supplies has been responsible for dramatically improving the public’s oral health.
Oral Health in the 1930s and 1940s
It has been said that those who cannot remember the past are condemned to repeat it. As generations
pass, details from life in the 1930s and 1940s fade. The oral health of Americans suffered greatly during
the Great Depression and into World War II. There were no public health programs in place that addressed
tooth decay, and the loss of teeth was viewed as an eventuality. In fact, as World War II approached,
those joining the US Army were required to have six back teeth (three on the top and three on the
bottom) that opposed each other to serve the function of chewing food as well as six front teeth (three
on the top and three on the bottom) that opposed each other for the purpose of biting into food. The
number of men disqualified for dental reasons far exceeded all expectations, as “dental disease” became
the most common reason for military deferment. One out of 11 registrants examined was disqualified for
military service due to dental issues.391 After Pearl Harbor, it was apparent that the manpower needed
to fight a global war could be obtained only if dental standards for induction were drastically relaxed.
By March 1942, the standards had been revised so that a man who was “well nourished, of good
musculature, and free from gross dental infections” but who was completely edentulous (without any
teeth) could be inducted if his condition was corrected or could be corrected with dentures.391
Because fluoridation reaches large numbers of people where they live, learn, work,
and play, it is more efficient than other forms of fluoride delivery.
In January 1945, the first US city to include community water fluoridation was Grand Rapids,
Michigan, followed within months by Newburgh, New York (May 1945), Brantford, Ontario (June
1945), and Evanston, Illinois (February 1947). The comparison of decay rates in the fluoridated cities
versus cities without community water fluoridation showed dramatically lower rates of tooth decay
in fluoridated cities.16 A classic study, the Newburgh-Kingston study of two cities in New York, one
fluoridated (Newburgh) and one non-fluoridated (Kingston), also showed substantially lower decay
rates in Newburgh.21 The optimal level for caries reduction without risk of fluorosis was found to be
1.0 ppm,17 leading to the rapid adoption of fluoridation in cities across the United States. As a result,
tooth decay declined sharply during the second half of the 20th century.18,392 Tooth loss was no
longer considered inevitable.18,392