© 2025 American Dental Association l 41
Fluoridation Facts
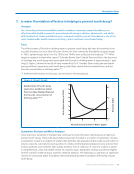
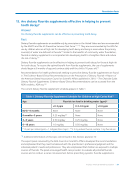
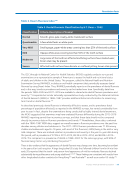
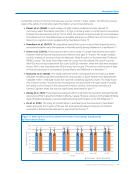
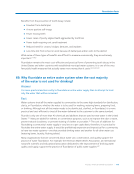
Figure 3: USEPA Standards and USPHS Recommendations for Fluoride in Drinking Water203
US Environmental Protection Agency (EPA) Standards for Fluoride in Drinking Water
The EPA standards for fluoride in drinking water apply to the naturally occurring fluoride in water.
They are the:
• Maximum Contaminant Level Goal (MCLG) – 4 mg/L
• Maximum Contaminant Level (MCL) – 4 mg/L
• Secondary Maximum Contaminant Level (SMCL) – 2 mg/L
MCLG — The MCLG is the levela of contaminants in drinking water at which no adverse health effects
are likely to occur. This health goal is based solely on possible health risks and exposure over a lifetime
with an adequate margin of safety. The current MCLG for fluoride is 4 mg/L and is set at this level to
provide protection against the increased risk of crippling skeletal fluorosis.
MCL — The MCL is an enforceable standard which is set as close to the health goal as possible,
considering the benefit to the public, the ability of public water systems to detect and remove
contaminants using suitable treatment technologies and cost. In the case of fluoride, the MCL
is set at the MCLG.
Under the MCL standard, if the naturally occurring level of fluoride in a public water supply exceeds
4 mg/L, the water supplier is required to lower the level of fluoride or defluoridate. Community water
systems that exceed the fluoride MCL of 4 mg/L must notify persons served by that system as soon
as practical, but no later than 30 days after the system learns of the violation.
SMCL — Secondary standards are non-enforceable guidelines regulating contaminants that may
cause cosmetic effects (such tooth discoloration). The EPA recommends secondary standards to
water systems but does not require systems to comply. However, states may choose to adopt them as
enforceable standards. Tooth discoloration and/or pitting is caused by excess fluoride exposures during
the formative period prior to eruption of the teeth in children. The level of the SMCL was set based
upon a balancing of the beneficial effects of protection from tooth decay and the undesirable effects
of excessive exposures leading to discoloration.
Under the SMCL, if water exceeds 2 mg/L, the water system is to notify consumers that regular
consumption of water with fluoride above 2 mg/L, may increase the risk for fluorosis in young (under
9 years of age) children. Community water systems that exceed the fluoride secondary standard of
2 mg/L must notify persons served by that system as soon as practical but no later than 12 months
from the day the water system learns of the exceedance.
US Public Health Service (USPHS) Recommendation for Fluoride in Drinking Water
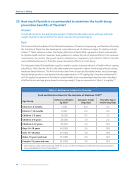
In 2015, the USPHS published a final report establishing guidance for water systems that are actively
fluoridating or those that may initiate fluoridation in the future. For community water systems that
add fluoride to their water, the USPHS recommends a uniform fluoride concentration of 0.7 mg/L for
the entire United States to maintain caries (tooth decay) prevention benefits and reduce the risk of
dental fluorosis.
Why is the EPA MCL of 4 mg/L different from the USPHS recommendation of 0.7 mg/L?
The two benchmarks have different purposes and are set under different authorities. The EPA MCL of
4 mg/L is set to protect against risks from exposure to too much fluoride. The USPHS recommended
level of fluoride on 0.7 mg/L is set to promote the benefit of fluoride in preventing tooth decay while
minimizing the chance for dental fluorosis.
Information Source: EPA Fact Sheet: Questions and Answers on Fluoride. 2011.
Available at https://www.epa.gov/dwsixyearreview/fact-sheet-questions-and-answers-fluoride
Fluoridation Facts
Figure 3: USEPA Standards and USPHS Recommendations for Fluoride in Drinking Water203
US Environmental Protection Agency (EPA) Standards for Fluoride in Drinking Water
The EPA standards for fluoride in drinking water apply to the naturally occurring fluoride in water.
They are the:
• Maximum Contaminant Level Goal (MCLG) – 4 mg/L
• Maximum Contaminant Level (MCL) – 4 mg/L
• Secondary Maximum Contaminant Level (SMCL) – 2 mg/L
MCLG — The MCLG is the levela of contaminants in drinking water at which no adverse health effects
are likely to occur. This health goal is based solely on possible health risks and exposure over a lifetime
with an adequate margin of safety. The current MCLG for fluoride is 4 mg/L and is set at this level to
provide protection against the increased risk of crippling skeletal fluorosis.
MCL — The MCL is an enforceable standard which is set as close to the health goal as possible,
considering the benefit to the public, the ability of public water systems to detect and remove
contaminants using suitable treatment technologies and cost. In the case of fluoride, the MCL
is set at the MCLG.
Under the MCL standard, if the naturally occurring level of fluoride in a public water supply exceeds
4 mg/L, the water supplier is required to lower the level of fluoride or defluoridate. Community water
systems that exceed the fluoride MCL of 4 mg/L must notify persons served by that system as soon
as practical, but no later than 30 days after the system learns of the violation.
SMCL — Secondary standards are non-enforceable guidelines regulating contaminants that may
cause cosmetic effects (such tooth discoloration). The EPA recommends secondary standards to
water systems but does not require systems to comply. However, states may choose to adopt them as
enforceable standards. Tooth discoloration and/or pitting is caused by excess fluoride exposures during
the formative period prior to eruption of the teeth in children. The level of the SMCL was set based
upon a balancing of the beneficial effects of protection from tooth decay and the undesirable effects
of excessive exposures leading to discoloration.
Under the SMCL, if water exceeds 2 mg/L, the water system is to notify consumers that regular
consumption of water with fluoride above 2 mg/L, may increase the risk for fluorosis in young (under
9 years of age) children. Community water systems that exceed the fluoride secondary standard of
2 mg/L must notify persons served by that system as soon as practical but no later than 12 months
from the day the water system learns of the exceedance.
US Public Health Service (USPHS) Recommendation for Fluoride in Drinking Water
In 2015, the USPHS published a final report establishing guidance for water systems that are actively
fluoridating or those that may initiate fluoridation in the future. For community water systems that
add fluoride to their water, the USPHS recommends a uniform fluoride concentration of 0.7 mg/L for
the entire United States to maintain caries (tooth decay) prevention benefits and reduce the risk of
dental fluorosis.
Why is the EPA MCL of 4 mg/L different from the USPHS recommendation of 0.7 mg/L?
The two benchmarks have different purposes and are set under different authorities. The EPA MCL of
4 mg/L is set to protect against risks from exposure to too much fluoride. The USPHS recommended
level of fluoride on 0.7 mg/L is set to promote the benefit of fluoride in preventing tooth decay while
minimizing the chance for dental fluorosis.
Information Source: EPA Fact Sheet: Questions and Answers on Fluoride. 2011.
Available at https://www.epa.gov/dwsixyearreview/fact-sheet-questions-and-answers-fluoride