46 l © 2025 American Dental Association
Section 2: Safety
23. How much fluoride is recommended to maximize the tooth decay
prevention benefits of fluoride?
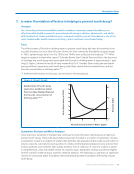
Answer
As with all nutrients, the appropriate amount of daily fluoride intake varies with age and body
weight. Fluoride is safe and effective when used and consumed properly.
Fact
The Food and Nutrition Board of the National Academies of Sciences, Engineering, and Medicine (formerly
the Institute of Medicine) has developed a comprehensive set of reference values for dietary nutrient
intakes.146 These reference values, the Dietary Reference Intakes (DRI), represent nutrient requirements
to optimize health and set maximum-level guidelines to reduce the risk of adverse effects from excessive
consumption of a nutrient. Along with calcium, phosphorous, magnesium, and vitamin D, DRIs for fluoride
were established because of fluoride’s proven preventive effects on tooth decay.
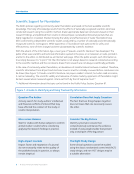
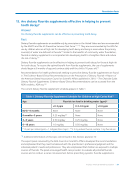
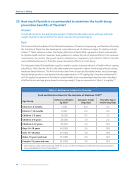
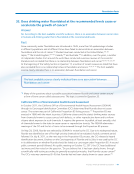
The Adequate Intake (AI) establishes a goal for intake to sustain a desired indicator of health without causing
side effects. With fluoride, the AI is the daily intake level required to reduce tooth decay without causing
moderate dental fluorosis. The AI for fluoride intake from all sources (fluoridated water, food, beverages,
fluoride dental products, and dietary fluoride supplements) is 0.05 mg/kg/day. Using the established AI
of 0.05 mg/kg, the amounts of fluoride for optimal health to be consumed each day have been calculated
stratified by sex and age group based on average weight they are presented in Table 2 in mg/day.146
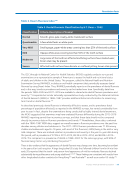
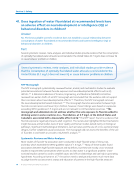
Table 2. Reference Intakes for Fluoride
Food and Nutrition Board of the Institute of Medicine 199740
Age Group Reference Weights
kg (lbs)*
Adequate Intake
(mg/day)
Tolerable Upper
Intake (mg/day)
Infants 0-6 months 7 (16) 0.01 0.7
Infants 7-12 months 9 (20) 0.5 0.9
Children 1-3 years 13 (29) 0.7 1.3
Children 4-8 years 22 (48) 1.0 2.2
Children 9-13 years 40 (88) 2.0 10.0
Boys 14-18 years 64 (142) 3.0 10.0
Girls 14-18 years 57 (125) 3.0 10.0
Males 19 years and over 76 (166) 4.0 10.0
Females 19 years and over 61 (133) 3.0 10.0
*Value based on data collected during 1988-94 as part of the Third National Health and Nutrition Examination
Survey (NHANES III) in the United States.40
Section 2: Safety
23. How much fluoride is recommended to maximize the tooth decay
prevention benefits of fluoride?
Answer
As with all nutrients, the appropriate amount of daily fluoride intake varies with age and body
weight. Fluoride is safe and effective when used and consumed properly.
Fact
The Food and Nutrition Board of the National Academies of Sciences, Engineering, and Medicine (formerly
the Institute of Medicine) has developed a comprehensive set of reference values for dietary nutrient
intakes.146 These reference values, the Dietary Reference Intakes (DRI), represent nutrient requirements
to optimize health and set maximum-level guidelines to reduce the risk of adverse effects from excessive
consumption of a nutrient. Along with calcium, phosphorous, magnesium, and vitamin D, DRIs for fluoride
were established because of fluoride’s proven preventive effects on tooth decay.
The Adequate Intake (AI) establishes a goal for intake to sustain a desired indicator of health without causing
side effects. With fluoride, the AI is the daily intake level required to reduce tooth decay without causing
moderate dental fluorosis. The AI for fluoride intake from all sources (fluoridated water, food, beverages,
fluoride dental products, and dietary fluoride supplements) is 0.05 mg/kg/day. Using the established AI
of 0.05 mg/kg, the amounts of fluoride for optimal health to be consumed each day have been calculated
stratified by sex and age group based on average weight they are presented in Table 2 in mg/day.146
Table 2. Reference Intakes for Fluoride
Food and Nutrition Board of the Institute of Medicine 199740
Age Group Reference Weights
kg (lbs)*
Adequate Intake
(mg/day)
Tolerable Upper
Intake (mg/day)
Infants 0-6 months 7 (16) 0.01 0.7
Infants 7-12 months 9 (20) 0.5 0.9
Children 1-3 years 13 (29) 0.7 1.3
Children 4-8 years 22 (48) 1.0 2.2
Children 9-13 years 40 (88) 2.0 10.0
Boys 14-18 years 64 (142) 3.0 10.0
Girls 14-18 years 57 (125) 3.0 10.0
Males 19 years and over 76 (166) 4.0 10.0
Females 19 years and over 61 (133) 3.0 10.0
*Value based on data collected during 1988-94 as part of the Third National Health and Nutrition Examination
Survey (NHANES III) in the United States.40